|
☁️📊 argoCloud – Different Views for Different Tasks with argoDashboard
With argoCloud, various dashboard views are available that are specifically designed to meet customer needs – for example for live monitoring, fleet management and voyage analysis.
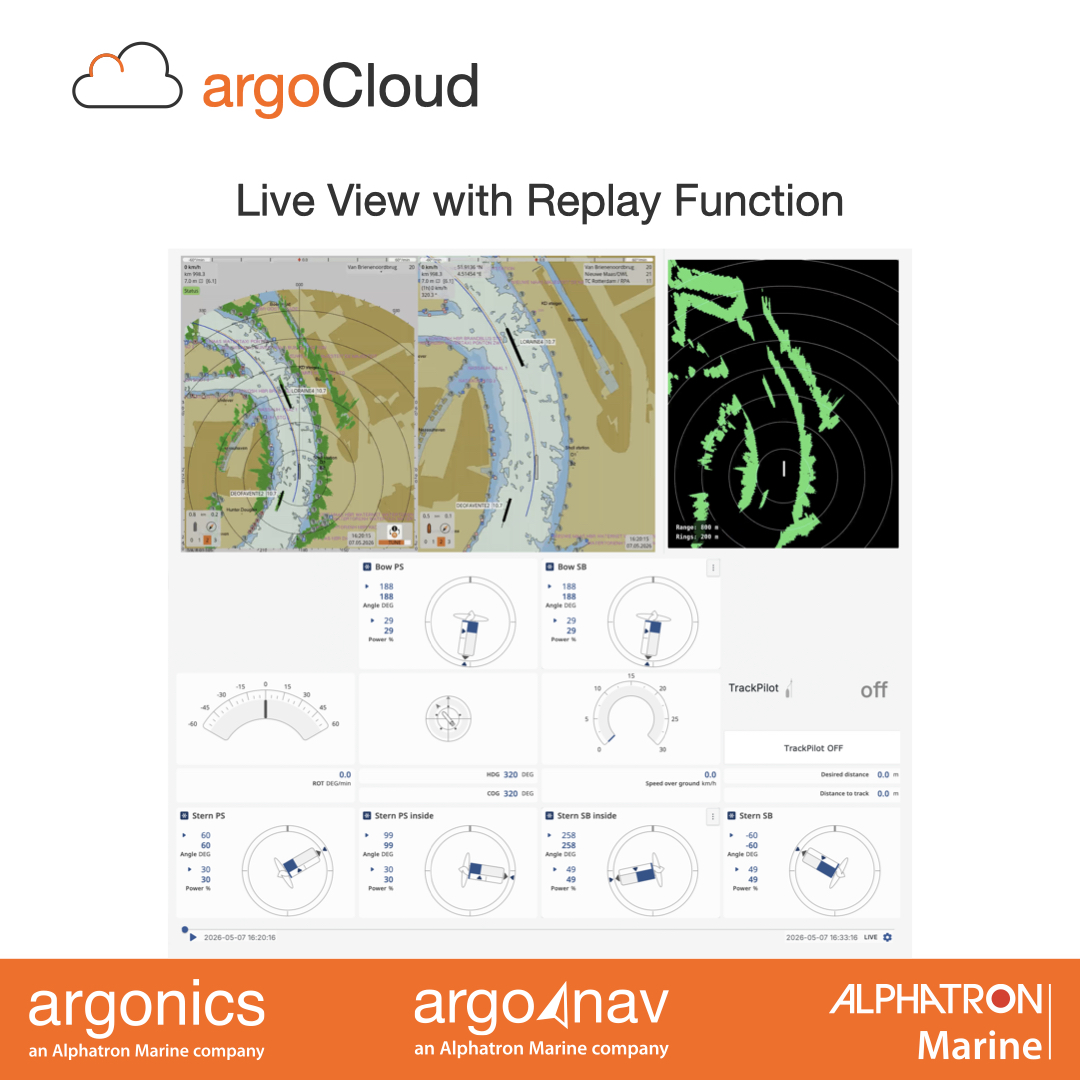
👀 Live View
Here you can immediately see what is happening in and around the vessel:
ECDIS, radar and camera recordings, audio recordings from various sources, position and navigation data, propulsion data, status of the argoTrackPilot and argoPositionPilot, and much more.
All data can be replayed both live and from historical records. One particularly important feature: the different data sources are synchronized during playback. This makes it possible to precisely analyze and review situations afterwards.
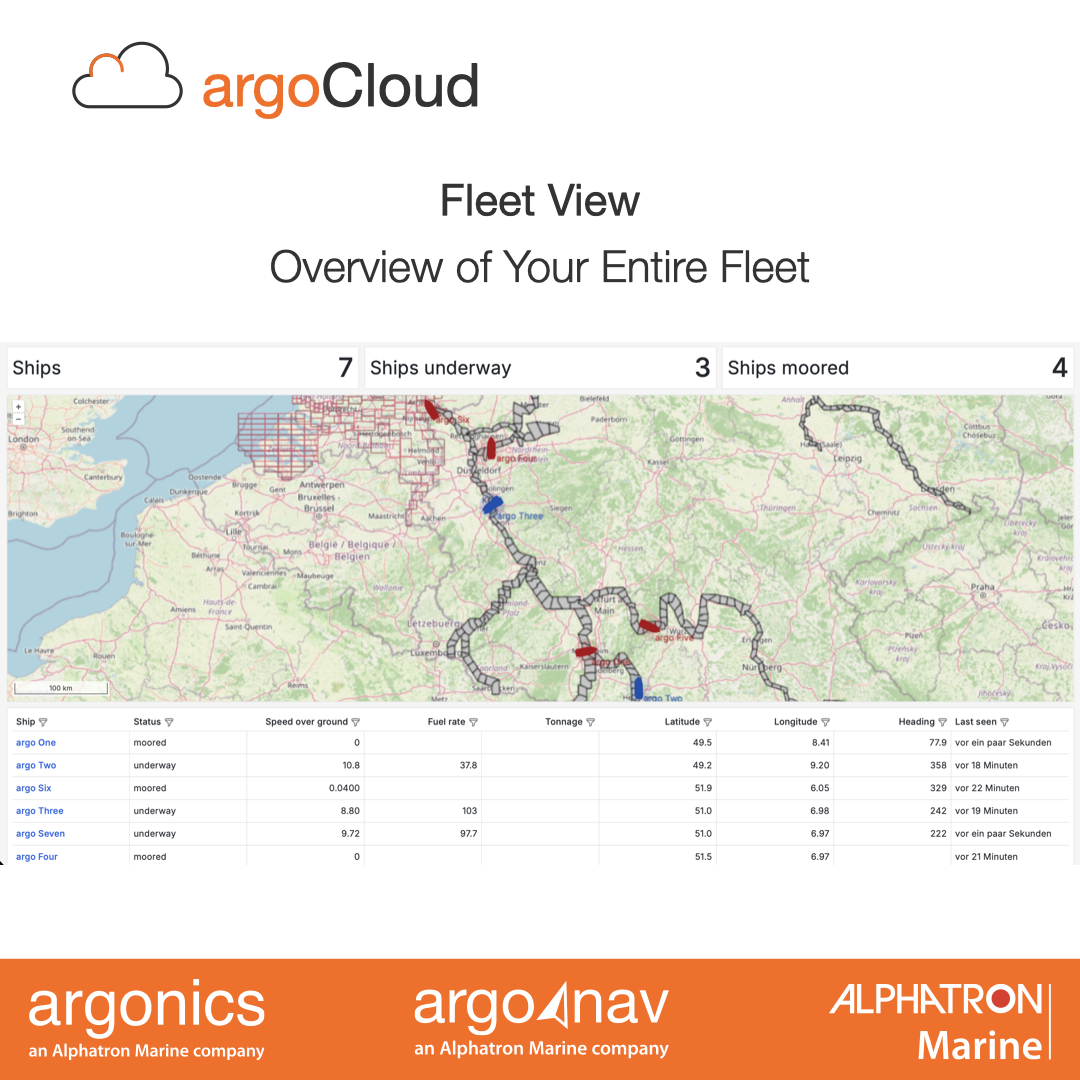
🗺️ Fleet View
Here, multiple vessels can be monitored simultaneously. In addition to a clear map view, status information (underway or at anchor), speed over ground, tonnage and further operational data of the individual vessels are available.
Fleet monitoring provides a quick overview of the current status of all vessels and simplifies dispatching, planning and coordination in daily operations.
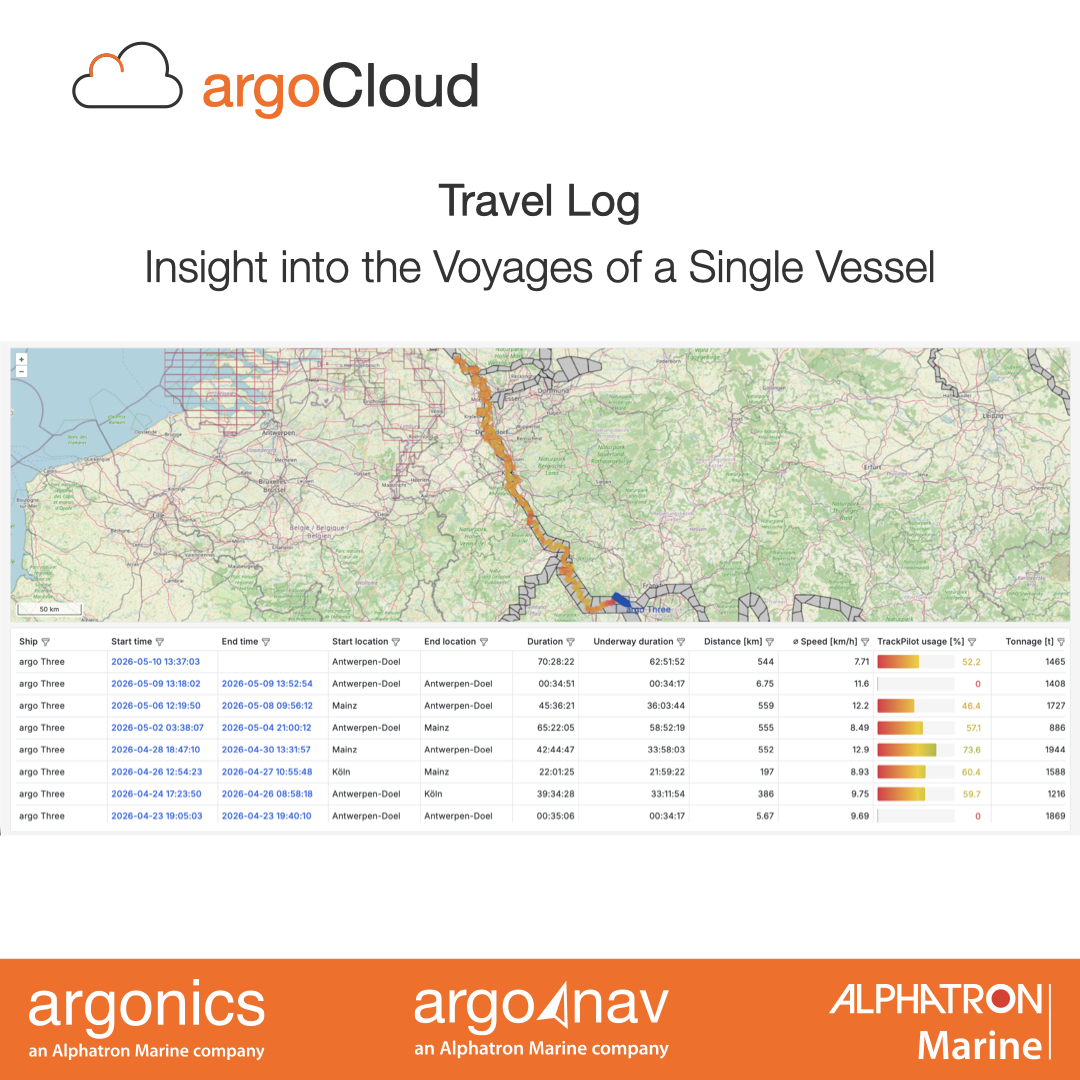
📖 Travel Log
The travel log provides a structured analysis of individual voyages. Among other things, information such as departure and destination, voyage duration, distance travelled and tonnage is available. If a trackpilot is installed, an additional usage statistic is displayed.
The voyage logbook simplifies the analysis of individual voyages and supports fuel consumption calculations, CO2 accounting, documentation and optimization of vessel operations. Especially in connection with Scope 3 emissions and the associated reporting obligations, traceable consumption and operational data are becoming increasingly important.
Interested?
Further information about argoCloud can be found on our homepage and in our blog:
https://argonics.de/tag/argocloud/